Democratic vs. Republican occupations
Written by Mark on 02 Jun 2015
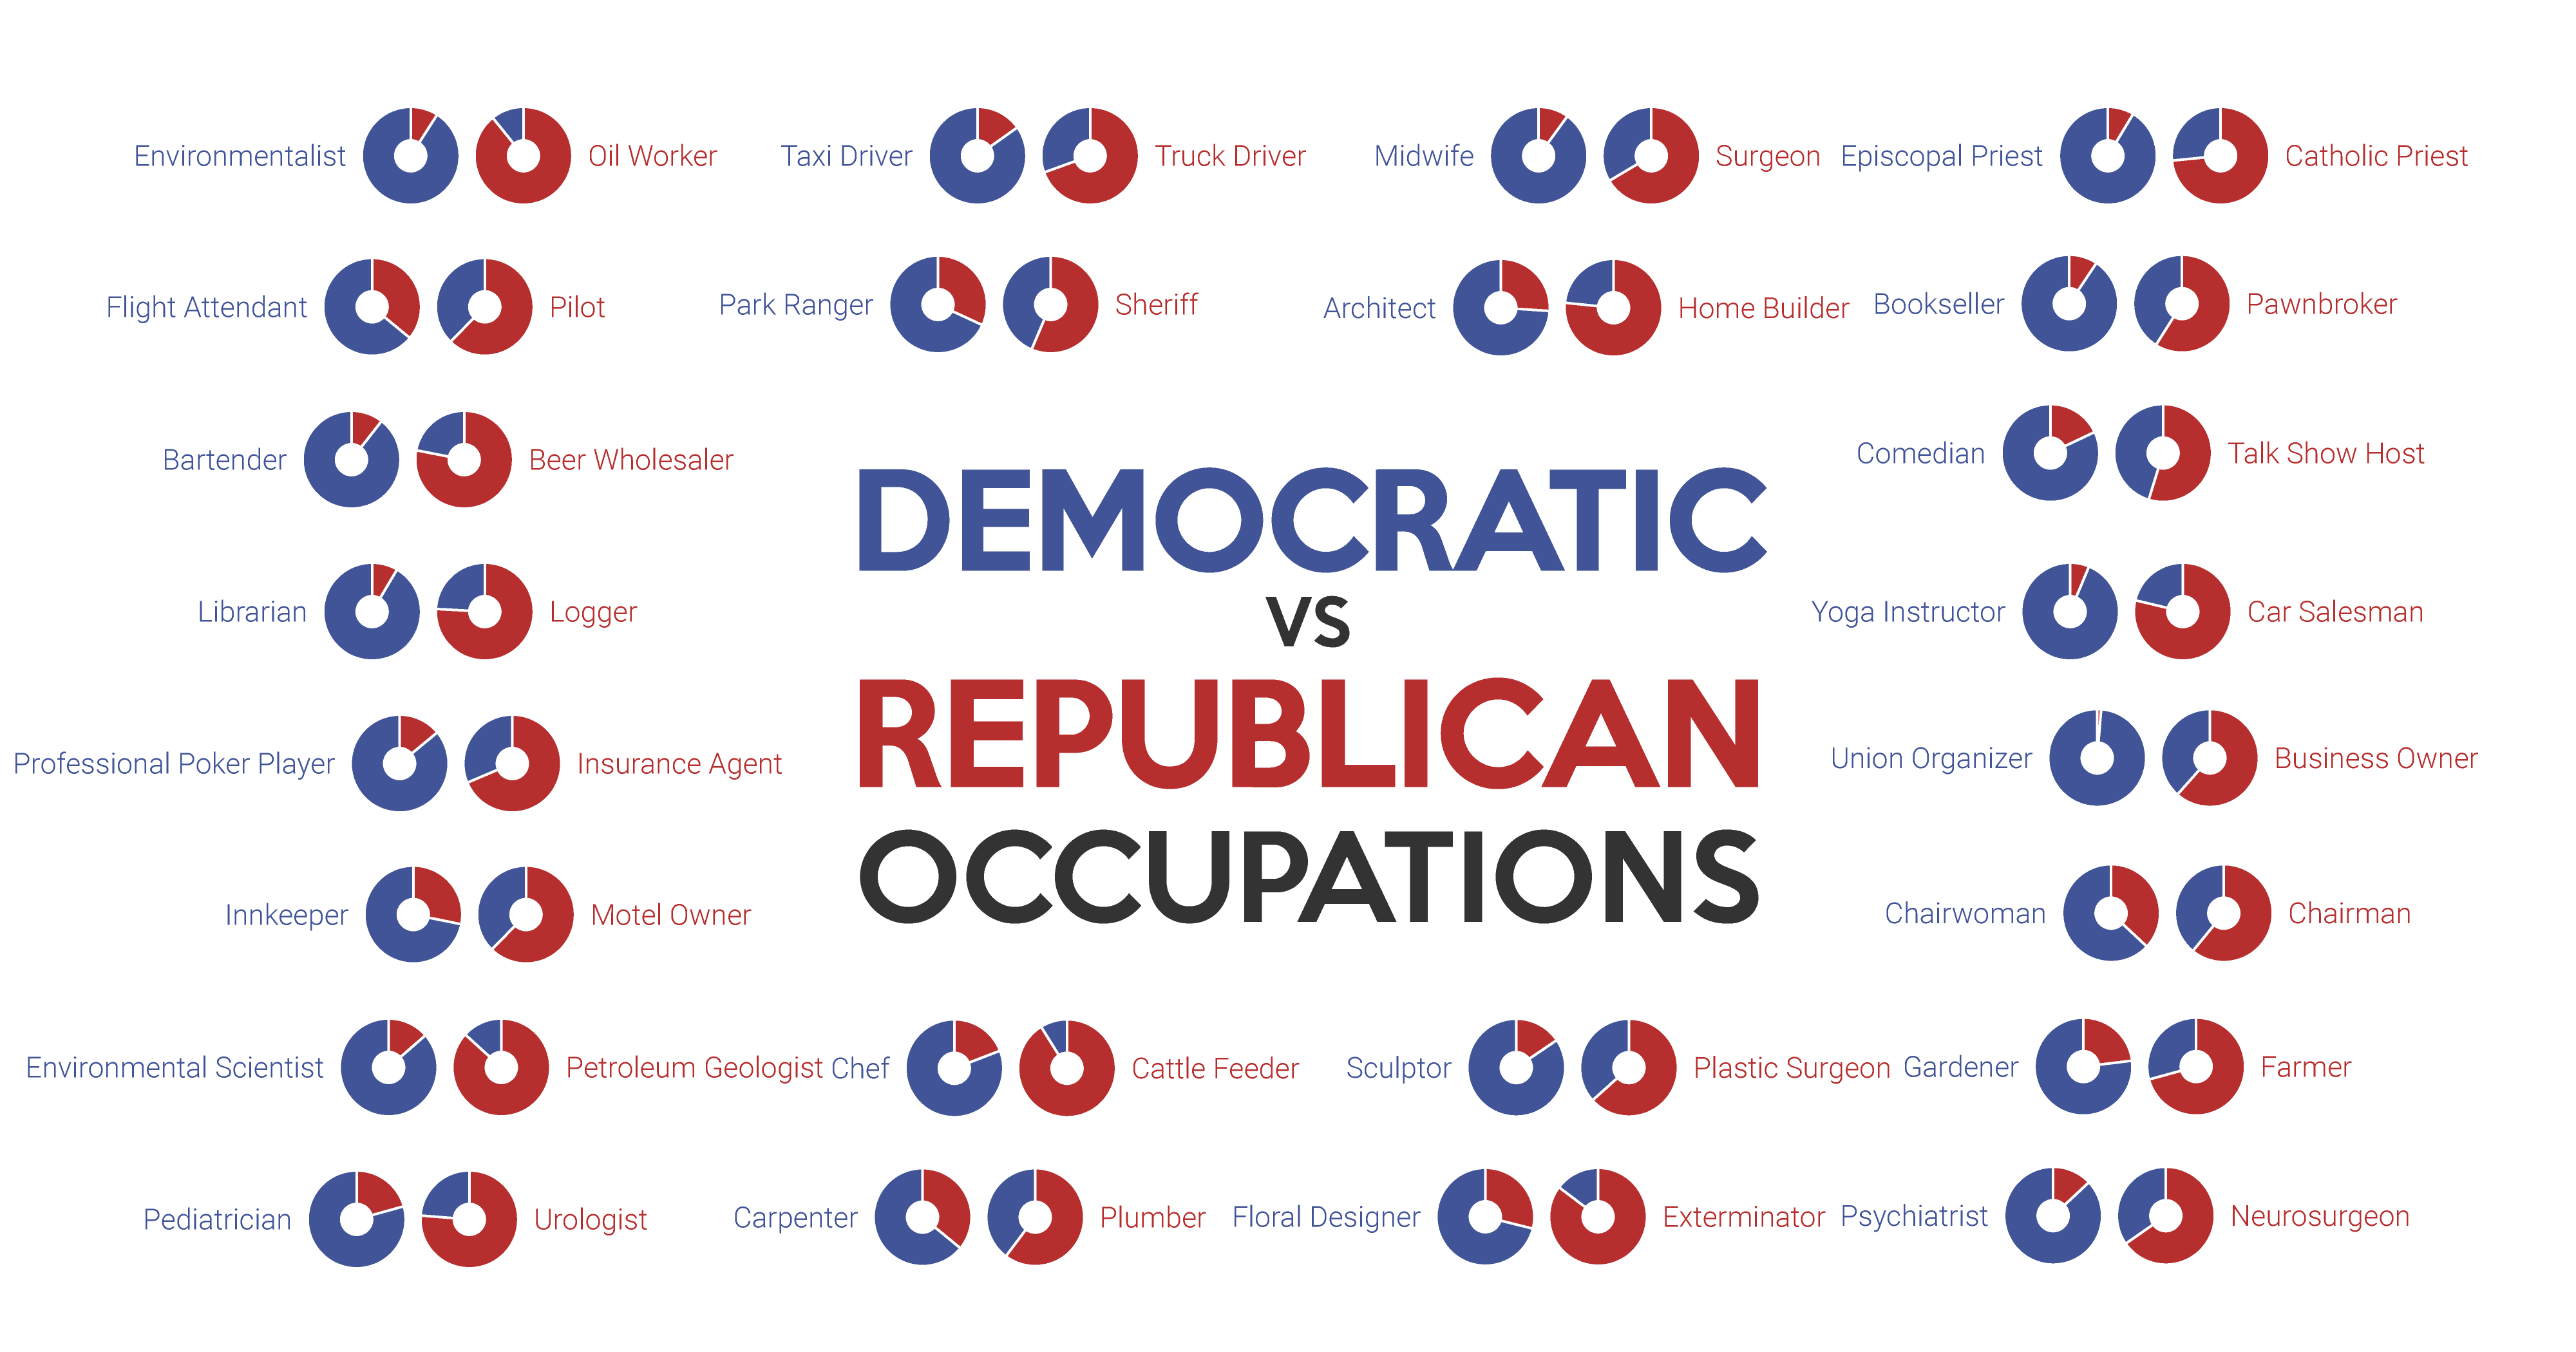
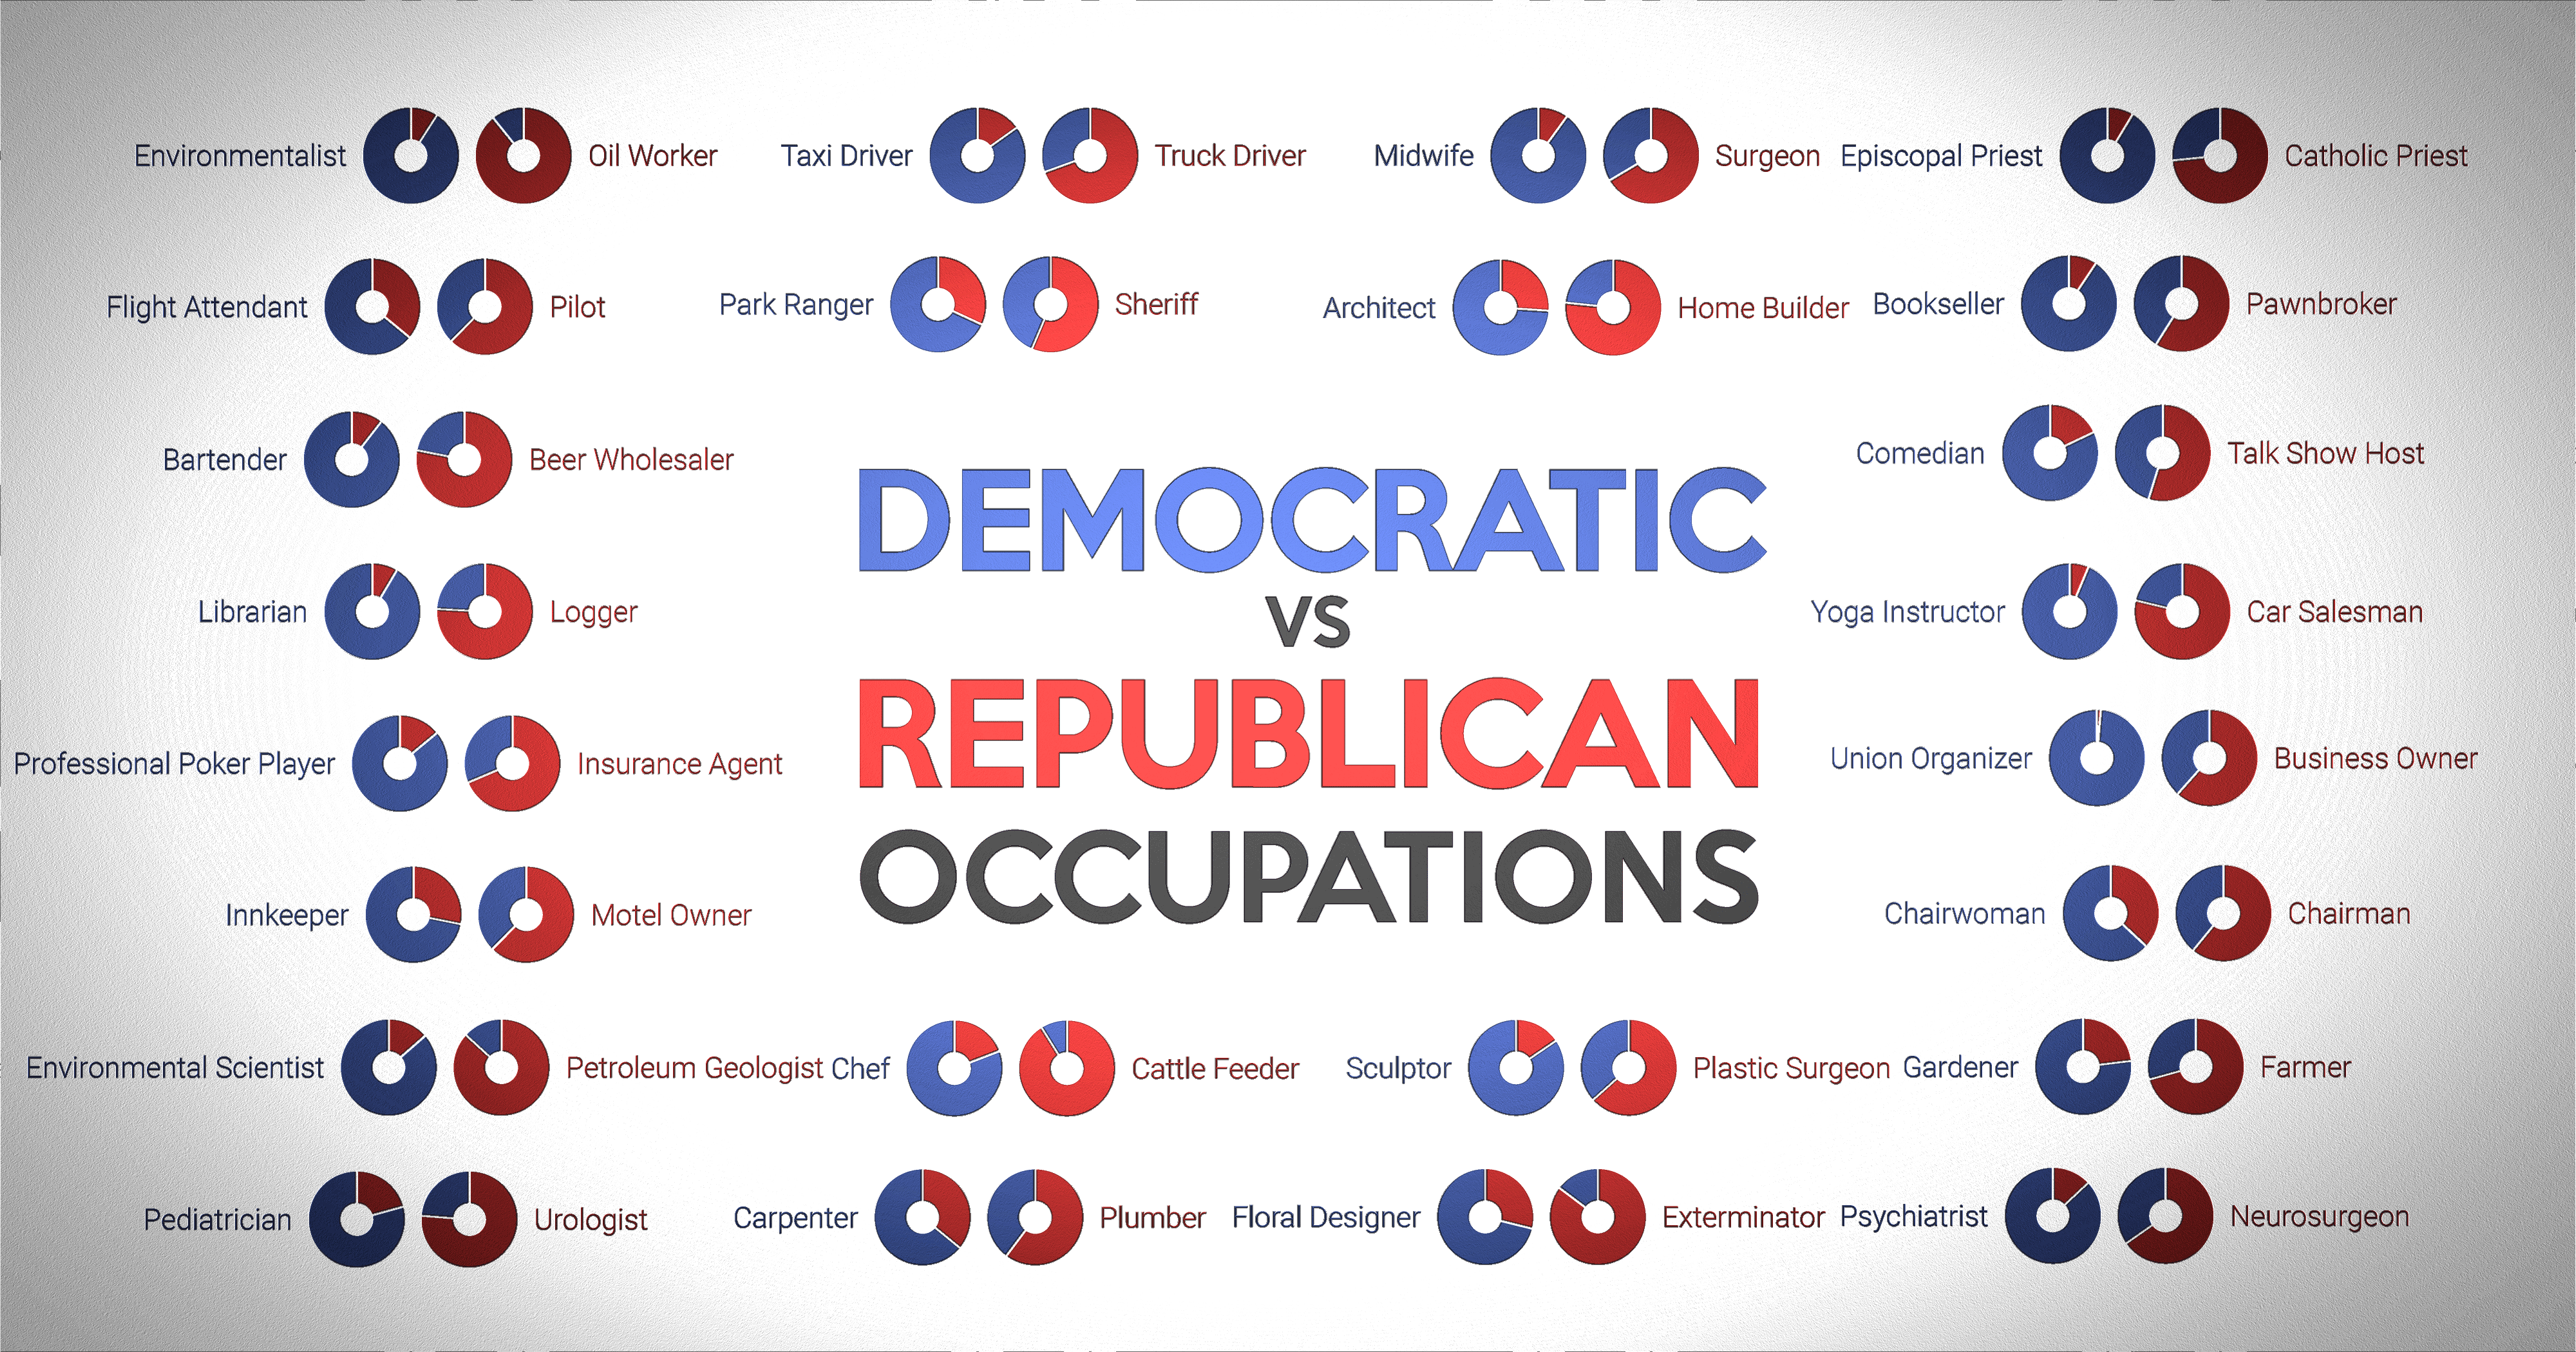
Are you an architect? It's likely that you're a Democrat. Pilot? Probably Republican. What about journalist? Fisherman? Bartender?
We've just posted a new chart that sheds light on this, the political bent of various professions. It's the third in a trio of visualizations sprouting from the data analysis we've been doing for the Baby Name Genius app.
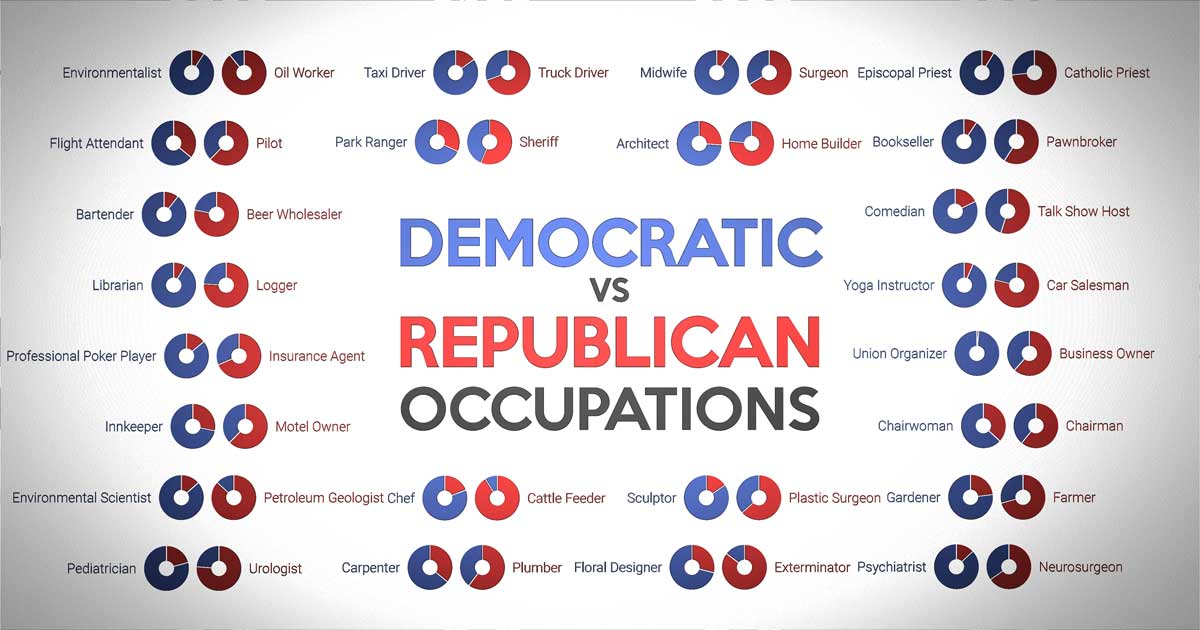
The results are especially interesting when you juxtapose professions that are aligned or opposed in some way. Not surprisingly, environmentalists and oil workers are at opposite ends of the spectrum. Why, though, are pediatricians overwhelmingly Democratic while urologists are overwhelmingly Republican?
Delving deeper
A closer look at the Democrat to Republican ratios leads to more subtle and not-so-subtle contrasts. For example, preschool teachers are twice as likely as high school teachers to be Republican, while economics professors are 7 times as likely as English professors to be Republican. Here's "how Republican" some other professions are vs. others:
- Restaurant owners: 4x as Republican as waitstaff
- Truck drivers: 12x as Republican as taxi drivers
- Car salespeople: 5x as Republican as retail salespeople
- Prosecutors: 17x as Republican as public defenders
- Motel owners: 4x as Republican as innkeepers
Here's the math
This analysis is possible because the Federal Election Commission (FEC) provides data that reveals who made what contribution to which political campaign, when they contributed, how much they contributed, what they call their occupation, and other info. We aggregated that data and applied a simple formula for each occupation:
Dem % for occupation = # of people who primarily gave to Dems/total Dem + Rep contributors
A caveat with this methodology is that we assume Democrats and Republicans contribute at a similar rate to each other within each profession. In other words, we assume that a 75 / 25 split of contributions by Democratic teachers vs. Republican teachers translates to a 75 / 25 split of Democrat vs. Republican teachers in the general populace. If it's actually the case that, say, Republican teachers are looser with their wallets and have a higher per capita contribution rate, our ratio for that profession will be a bit skewed. Thus, the ratios should be viewed as approximate.
Links
Here's the link in case you missed it:
See also:
- The Baby Name Genius app for iOS and Android
- Chart: Disproportionately common names by profession
- Chart: Democratic vs. Republican names
High-resolution images:
- "Democratic vs. Republican occupations" PNG, PNG w/ vignette